Chat metrics in a sale week: why comparing with the previous week misleads
Why comparing with the previous week mostly shows the season in a sale week, and how to read shares, time new versions and choose the day you read.
In plain language
In a sale week, more people come to the shop. So many numbers in your chat analytics go up, even if you did nothing.
The analytics puts each time span next to the span of the same length just before it. The arrow then shows the season, not your change. The national office for statistics takes such waves out of its numbers. The chat analytics does not do that.
So look at shares more than at plain counts. Change your assistant before or after the peak, not in the middle of it.
On the Friday before Black Week, the assistant's analytics usually still look ordinary. A week later many cards show strong arrows pointing up, and another week later pointing down. Both arrows come from the same comparison: every window stands next to the preceding window of equal length, and in the sale week that preceding window is an ordinary week. What the arrow shows then is mainly the season, not the latest change to the assistant. The analytics says so itself: what can be read is the direction, not the cause. This article describes how the metrics can still be read sensibly in a sale week: why official statistics rely on adjusted figures for short-term comparisons and chat analytics does not, which cards are especially easy to misread, when a new version should be published, on which day reading pays off, and why a missing value is not a decline.

Labels in the illustration
- Conversations per day
- Week before
- Sale week
- Version on 27 Nov
- Version on 8 Dec
- 1 Nov
- 17 Nov
- 24 Nov
- 1 Dec
- 8 Dec
- 15 Dec
- Week before vs. sale week
- The arrow shows the season, not the measure
- Version at the peak
- Before and after are mixed
- Version afterwards
- Both 7-day windows miss the peak
What the comparison in analytics computes
The analytics page is part of conversation analytics and is available if your plan includes it. At the top of the analytics page you choose the window: 7, 30 or 90 days, with 30 as the default. The window ends today, and the current day is included. Below every card stands the value of the preceding period, with an arrow for the direction and the difference in brackets. That preceding period is just as long and just as far advanced as the chosen window: if someone reads in the morning, the current day counts up to now and the matching day in the preceding period up to the same time of day. A difference only appears where both values have been measured. Topics also carry the figure of the preceding window of equal length and a direction. Unlike the cards, however, they count the full preceding window: early in the day the earlier figure is therefore somewhat higher and topics tend to point down, including in the weekly report on Monday morning. How the analytics is built overall is described on the conversation analytics page.
The comparison is deliberately plain. It computes no expected value, no trend and no seasonal factor; it places two counted values side by side. There is a reason for this: every card is meant to rest on counts, and an estimated normal value would be a figure nobody measured. The flip side is that the comparison pays no attention to the calendar. If a sale week, a public holiday or a newsletter with a wide reach falls into one of the two windows, that influence sits inside the direction, unseparated.
Direction, not cause
An arrow below a card says that a value has moved compared with the preceding period. Why it moved, it does not say: the analytics proves no effect of a change and does not separate out what chance or season contributed. Putting it in context is your task, and in a sale week that task is bigger than usual.
Why the week before is a baseline in a sale week
In 2026, Black Friday falls on 27 November and Cyber Monday on 30 November. Many shops stretch their sale across the whole week or start a few days earlier. For the analytics this means: anyone looking at the 7-day window on the Monday after Black Friday compares the days of the sale with the seven days before, that is with a week in which the shop ran as usual or was only just getting going. The preceding period is therefore no yardstick for what was to be expected in the sale week, but a baseline from a different situation.
In a sale week it is not only the volume that changes. Different visitors arrive, many of them seeing the shop for the first time and asking basic questions. Different questions arrive: about sale conditions and discount codes, delivery times before Christmas, returning gifts and items that are sold out. And the shop itself changes, with sale pages, banners and altered prices. Each of these shifts moves cards in the analytics without anything having been changed in the assistant. How the chat can deal with items that have run out is described in the article Sold out in the sales week.
- More conversations and more messages, because more visitors are in the shop.
- New topics that did not exist in the preceding period, for example about sale codes or delivery deadlines before Christmas.
- More first-time visitors asking basic questions about shipping, payment and returns.
- More short conversations that end after one answer, because visitors compare and click on.
- Changed pages in the shop that questions refer to before the knowledge base knows the new state.
What official statistics adjust and analytics does not
How far apart a raw and an adjusted comparison can be is shown by a press release from the Federal Statistical Office on the 2025 Christmas trade. According to it, retail sales in December 2025, based on preliminary results, were 3.2 percent (Destatis) higher in real terms than in December 2024. Adjusted for calendar and seasonal effects, the real increase was 1.5 percent (Destatis). The same month, the same comparison with the same month of the previous year, two figures: the gap comes from the adjustment, in this year-on-year comparison mainly for calendar effects such as the number of trading days. Anyone who reads only the first figure sees stronger growth than remains after that adjustment. For the short-term comparison with the previous month, the statistics expressly rely on calendar- and seasonally adjusted values, as their methodological note states.
In all releases on business-cycle indicators, the different comparison periods must be taken into account. The focus of business-cycle monitoring is the comparison of calendar- and seasonally adjusted values with the previous month or previous quarter. From this, the short-term economic trend can be read.
The comparison in chat analytics corresponds to the comparison with the previous month, only over a window of days and on raw values. No adjustment takes place, and none is imitated: for that the analytics would have to estimate a usual seasonal pattern, but it works with windows of at most ninety days and estimates nothing it has not counted. It offers no comparison with the same week of the previous year. Nor does it offer a comparison with other businesses, because an industry value that nobody measured would be invented. What official statistics achieve with a method remains a question for the reader here: what was going on in both windows?
Which cards can mislead in a sale week
The analytics keeps usage and answer quality apart, so that volume and quality do not blur into one. In a sale week this separation is especially useful, because the usage cards follow the rush almost inevitably. The following overview names typical patterns; whether they occur in your shop only your own counts will show.
| Card | What typically happens in a sale week | How to read it |
|---|---|---|
| Conversations, messages | Rise with the number of visitors | As a volume signal; they say nothing about answer quality |
| Handovers | Rise with the conversations, even when the rate stays the same | Read the “Handed to a human” share and the handover rate per topic |
| Abandoned, abandonment rate | More short conversations from visitors who compare | Look for clusters at the same point, not at the total |
| Topics with direction | New sale topics showing “before 0” or strong growth | Separate expected seasonal topics from genuine gaps |
| Answers with a source, Detected gaps | New questions for which the knowledge is still missing | Check per topic whether the sale conditions are in the knowledge base |
| Without an answer | Rises when answer runs fail and visitors get the fallback answer, not when knowledge is missing | Look at the entries under “Questions without an answer” before you add knowledge |
| Turned away | Requests that end before the model call, for example when the quota is used up | Check usage before you suspect weak answers |
An example of the confusion: if the number of handovers rises sharply in the sale week, it is tempting to assume that the assistant has got worse. If, however, the share of handed-over conversations stays at the level of the week before, nothing recognisable has changed in quality; there were simply more conversations. Conversely, an unchanged number of handovers alongside clearly more conversations can mean a falling rate. Turned-away requests call for a caution of their own: if they have risen, the reason may lie with the quota rather than with the answers. How that plays out in a busy week is described in the article Quota in the sale week.
Reading shares, with numerator and denominator
Shares hold up better against a plain rush than volumes do. If twice as many conversations take place and twice as many are handed over, the rate stays the same, and that is exactly the information that matters in a busy week. The analytics shows every share with numerator and denominator, rounded to one decimal place. That keeps it visible whether a rate comes from a few cases or from many; a rate based on a handful of conversations fluctuates from week to week without anything having changed.
Shares are still not free of the season. If the mix of questions changes, a share computed over all conversations changes too. Questions about sale conditions that have only applied since Monday may not yet be in the knowledge base; the share of answers with a source then falls, although the other answers are as well referenced as before. Likewise, the abandonment rate can rise because more visitors only compare briefly. The way out is the breakdown: the handover rate is shown per topic, and the list of knowledge gaps shows for which questions the references are missing.
- Look at the volumes first and note them as the rush, not as a result.
- Then read the quality shares: Solved on its own, Handed to a human, Without an answer, Answers with a source.
- For every conspicuous share, check numerator and denominator: how many cases lie behind it?
- Go through the topics with their direction and separate seasonal topics from genuine gaps.
- Only then ask whether a change to the assistant has moved anything.
Publishing changes before or after the week
The before-and-after comparison around a version is the tool the analytics provides specifically for the question of whether a change worked. It appears when a single assistant is selected at the top. Under version you choose a published version, and the analytics places two windows of equal length around the moment of publication, each as long as the chosen period. The table shows ten cards with before, after, difference and direction, green with “better” or red with “worse” where a metric has a desired direction. If the full period has not yet passed since publication, a note above it states how many days the window after it covers so far. How versions are created and restored is described in the documentation on assistants.
Publication is therefore the mark on which everything depends. If it falls in the middle of the peak, the comparison sets the run-up to the sale against the sale itself, or the sale against its tail end. The difference then mainly shows the season, and the colours reinforce the wrong impression: an abandonment rate that rises in the sale week appears in red as “worse” in the row of the new version, even if the version had no part in it. The analytics itself states that the table cannot show whether the version caused a difference; in a sale week, that sentence should be taken literally.
| Publication | Window before (7 days) | Window after (7 days) | What the difference mainly shows |
|---|---|---|---|
| Friday, 13 November | 6 to 13 November | 13 to 20 November | Both windows before the sale: most likely the change, with few conversations also chance |
| Friday, 20 November | 13 to 20 November | 20 to 27 November | The window after covers the sale week up to Black Friday: mostly the season |
| Friday, 27 November | 20 to 27 November | 27 November to 4 December | Sale week up to Black Friday against peak and tail end: mostly the season |
| Tuesday, 8 December | 1 to 8 December | 8 to 15 December | Both windows after the sale week, but within the Christmas trade |
- Publish changes that the sale requires early, so that both windows lie before the run-up where possible.
- During the peak, do not publish a version whose effect you want to read later; urgent corrections take priority, but their difference stays blurred.
- Collect non-urgent changes and publish them after the peak in such a way that the window before also lies after the sale week.
- For every version, record what was changed and which sale was running at the time.
Choosing when to read deliberately
A freely chosen window, such as the two weeks before the sale against two weeks after it, does not exist in the analytics. The windows are 7, 30 or 90 days long and end today. The lever is therefore the day on which you read, together with the length of the window. The following overview shows what the two windows cover on a few days around Black Week.
| Reading on | Window | Chosen period | Preceding period | What the direction mainly shows |
|---|---|---|---|---|
| Friday, 20 November | 7 days | 14 to 20 November | 7 to 13 November | Two ordinary weeks, provided the sale has not started yet |
| Monday, 30 November | 7 days | 24 to 30 November | 17 to 23 November | Sale week against the week before: arrows up from the season |
| Monday, 7 December | 7 days | 1 to 7 December | 24 to 30 November | Tail end against peak: arrows down, no setback |
| Monday, 14 December | 7 days | 8 to 14 December | 1 to 7 December | Both weeks after the sale, both within the Christmas trade |
| Monday, 30 November | 30 days | 1 to 30 November | 2 to 31 October | A month with a peak against a month without |
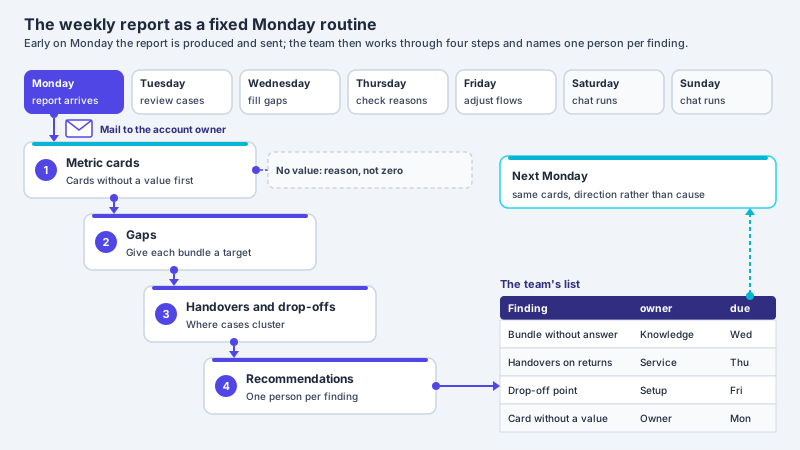
The weekly report follows the same logic. It computes over seven calendar days up to the Monday on which it is sent and, if your plan includes analytics, names the topics that were more frequent than in the preceding period of equal length. In the report of 30 November these are likely to be mostly sale topics; in the report of 7 December the same topics drop back. That is not a finding about the assistant but about the calendar. It helps to keep the reports of 9 and 16 November: they record what an ordinary week looked like before the sale began. How a team works with the report is described in the article Weekly report of the assistant.
A missing measurement is not a decline
A card without a basis shows “Not measured” and the reason below it, not a zero. In a sale week this matters more than usual, because a missing value next to many rising ones easily looks like a slump. If, for instance, no visitor rated an answer in the window, the “Rated helpful” card shows the reason and no figure. A difference only appears where both values have been measured; if one is missing, none is shown, rather than claiming a fall to zero.
The preceding period can be missing too. If it cannot be computed completely from the stored data, the reason appears there: it reaches back beyond the retention period for conversations, or it begins before the account or the selected assistant existed. A new account starts with a period of 90 days for all conversations; anyone who then chooses the 90-day window gets a reason instead of a figure for the preceding period. For topics, “no comparable period” only appears if the whole preceding window had no question with a topic or reaches back beyond the retention period. A single topic that did not exist before, by contrast, shows “before 0” and a rising direction, although it is simply new. For a sale topic, such a rise from zero is neither a measuring error nor a finding about the assistant. Which periods apply is set out under retention and deletion.
Two time limits affect precisely the busy evenings of the sale week. A conversation only counts as abandoned once more than half an hour has passed since the last message; the most recent half hour therefore cannot yet be counted for drop-offs, and an abandonment rate read on the evening of Black Friday may come out too low. In addition, the service keeps every result for one minute; measuring again within that time can return the same figures. Anyone who wants to record a figure reads it with some distance from events.
A reading guide for the sale week
The sections above add up to a sequence in three phases. It requires no special feature, only a fixed routine and a short list with dates. How to prepare the week in the chat itself, that is answers, lead time and handovers, is described in the article Peak season: absorbing support spikes in chat; this one is only about reading the figures.
-
Before the run-up
Publish the versions you need, add the sale conditions to the knowledge base, keep the weekly reports of ordinary weeks and start a list in which every sale, every newsletter and every version appears with its date.
-
During the sale week
Read volumes as the rush, check shares with numerator and denominator, separate new topics from gaps and close gaps promptly. Do not publish a version that is to be assessed later, and note every emergency correction with its time.
-
After the peak
Read the falling arrows as the end of the sale. Only assess the 7-day window once the preceding period also lies after the sale week, that is from about mid-December.
For discussions in the team, one fixed question for every figure helps: what was going on in both windows? If it can be answered in half a sentence, such as “ordinary week before, sale now”, the direction is placed in context. If it cannot be answered, the figure is not yet ready for a decision. Which signals the analytics captures overall and how they turn into improvements is described in the article Conversation analytics: evaluating and improving chats.
Frequent questions
Why do almost all cards point upwards in the sale week?
Because every card is compared with the preceding period of equal length. In the sale week that is usually an ordinary week with fewer visitors. The arrows then mainly show the rush and the season. Whether the assistant answers better or worse can be read from the shares with numerator and denominator rather than from the volumes.
Does the analytics remove seasonal or calendar effects?
No. It places counted values side by side and estimates no seasonal factor. Official statistics, by contrast, publish adjusted figures: for December 2025 the Federal Statistical Office reported 3.2 percent (Destatis) more real sales than in the same month of the previous year, and 1.5 percent (Destatis) adjusted for calendar and seasonal effects. In the assistant's analytics, placing the arrows in context is up to you.
Can I choose my own comparison window outside the sale week?
Not freely. The windows cover 7, 30 or 90 days and end on the current day; the comparison is with the preceding period of equal length. What you can control is the day on which you read. For a change to the assistant there is also the before-and-after comparison around a published version.
When should I publish a new version if I want to read its effect?
As a rule, so that both windows of the comparison lie outside the peak: early enough before the run-up to the sale, or far enough after it that the window before also lies after the sale week. A version in the middle of the peak compares the run-up with the sale itself. Even with good timing, the table proves no effect; it shows a direction.
A card shows “Not measured”. Is that a decline?
No. “Not measured” means that there was no basis for this metric in the window, for example no rating by visitors. The reason appears below it. A zero would be a statement about something that was not counted; that is why the analytics shows the reason instead of a figure, and no difference.
Can I compare my figures with other shops?
The analytics offers no comparison with other businesses, because an industry value that nobody measured would be invented. As a rule, the comparison with your own ordinary weeks is more meaningful, for example using weekly reports kept from the time before the sale.
Ask it yourself, Assistant of this website
Automated assistant